使用Prometheus监控Cache集群
使用Prometheus监控Cache集群
Executive Summary
生产级别的Cache集群往往由多个Cache实例组成,而Cache自带的管理界面不能满足对整个集群的监控,因此在实际使用中,往往需要投入人力对实例进行性能巡检。即便如此,这种巡检模式实时性低、告警的漏报错报率高、对既往数据追溯能力差。针对Cache/IRIS集群管理的这一缺憾,本文提出以Prometheus监控Cache集群的方案,最终实现了对集群全实例监控指标的自动化采集,以及准实时监控数据展示和告警提示。
Prometheus及Grafana简介
Prometheus是一个开源的监控收集框架。它内置了一个数据收集服务、一个时序数据库、和一个Web UI管理界面。 Prometheus采用PULL模式拉取监控数据,使得它在众多监控解决方案中脱颖而出。这种PULL模式只需被监控对象暴露出符合Prometheus要求的接口即可,而无需配置监控服务器地址,也无需管理定时任务,对应用程序的侵入性极小。 Prometheus也有一个健全的生态。它提供各种管理接口API,如自动服务发现、告警、查询等接口,和已有开源软件互操作性好,也方便接入机构内部系统。其中Grafana是最重要的生态伙伴,它是一个开源的数据可视化工具,支持动态的更改数据源、灵活地配置报表、编写Prometheus查询语句、定义告警等。因为这些特性,它常用于性能监控领域。
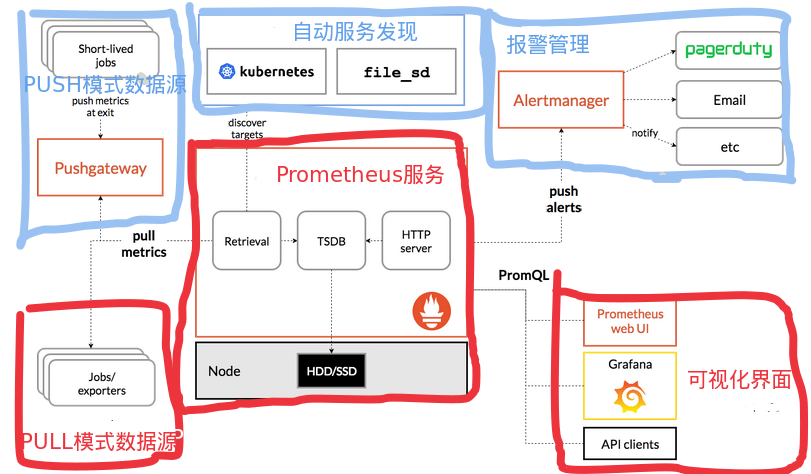
下图是Prometheus的典型架构,本文只关注其中红色部分。
Cache常用监控指标
本文总结了License使用量、Ensemble队列消息排队数量、事务持续时长、数据库可用空间,这4个常用的数值类型的监控指标,这四个指标直接影响或指示出系统的健康程度。以下是这四个指标的获取方法。
- License使用量
s LicenseUsed=##class(%SYSTEM.License).LUConsumed()
s LicenseAvailable=##class(%SYSTEM.License).LUAvailable()
s LicenseTotal=##class(%SYSTEM.License).GetUserLimit()
- Ensemble队列消息排队数量
Set statement=##class(%SQL.Statement).%New(1)
Set sc=statement.%PrepareClassQuery("Ens.Queue","Enumerate")
Set rset=statement.%Execute()
- 事务持续时长
set rs=##class(%ResultSet).%New()
set rs.ClassName="%SYS.Journal.Transaction"
set rs.QueryName="List"
set sc=rs.Execute(0)
- 数据库可用空间
Set statement=##class(%SQL.Statement).%New(1)
Set sc=statement.%PrepareClassQuery("%SYS.DatabaseQuery","FreeSpace")
Set rset=statement.%Execute()
Cache中Prometheus接口定义
本文实现了Prometheus接口。该接口中的jsonToPrometheus()方法将JSON转换为Prometheus需要的格式,为后期扩展出通用的Prometheus监控指标采集和埋点提供了基础。接口定义如下,
Class HospModule.HxeyPrometheusMetrics.RestController Extends %CSP.REST
{

XData UrlMap
{
<Routes>
    <Route Url="/prometheus" Method="GET" Call="MetricsPrometheus" />
    <Route Url="/json" Method="GET" Call="MetricsJson" />
  </Routes>
}

ClassMethod MetricsPrometheus() As %Status
{
    set %response.ContentType="text/plain;version=0.0.4;charset=utf-8"
    s json=..getMetricsJson()
    s iter=json.%GetIterator()
    while iter.%GetNext(.key, .value) {
        s promStr = ..jsonToPrometheus(value)
        w promStr
    }
    return $$$OK
}

ClassMethod MetricsJson() As %Status
{
    s json=..getMetricsJson()
    w json.%ToJSON()
    return $$$OK
}

/// Requires JSON format in this form: {"name":"hxey_ics_license_used","tags":[{"name","","value":""}],"desc":"已用License数","value":0}
ClassMethod jsonToPrometheus(json) As %String
{
    s retStr = ""
    s name=json.name
    s desc=json.desc
    s value=json.value
    s tags=json.tags

    s retStr = retStr_"# HELP "_name_" "_desc
    s retStr = retStr_$CHAR(10)
    s retStr = retStr_"# TYPE "_name_" gauge"
    s retStr = retStr_$CHAR(10)
    if (tags.%Size()=0) {
        s retStr = retStr_name_" "_value
        s retStr = retStr_$CHAR(10)
    } else {
        s retStr = retStr_name_"{"
        s iter2=tags.%GetIterator()
        while iter2.%GetNext(.key, .tag) {
            s tagName=$REPLACE(tag.name,"""","")
            s tagValue=$REPLACE(tag.value,"""","")
            s retStr = retStr_tagName_"="""_tagValue_""","
        }

        s retStr = retStr_"} "_value
        s retStr = retStr_$CHAR(10)
    }
    return retStr
}

ClassMethod getMetricsJson() As %DynamicAbstractObject
{
    s json=[]
    IF (##class(%Dictionary.CompiledClass).%ExistsId("%SYSTEM.License")) {
        s LicenseUsed=##class(%SYSTEM.License).LUConsumed()
        s item={"name":"hxey_ics_license_used","tags":"","desc":"已用License数","value":0}
        s item.tags = []
        s item.value = LicenseUsed
        d json.%Push(item)

        s LicenseAvailable=##class(%SYSTEM.License).LUAvailable()
        s item={"name":"hxey_ics_license_avail","tags":"","desc":"可用License数","value":0}
        s item.tags = []
        s item.value = LicenseAvailable
        d json.%Push(item)

        s LicenseTotal=##class(%SYSTEM.License).GetUserLimit()
        s item={"name":"hxey_ics_license_total","tags":"","desc":"License总量","value":0}
        s item.tags = []
        s item.value = LicenseTotal
        d json.%Push(item)

        s item={"name":"hxey_ics_license_load","tags":"","desc":"License占用率","value":0}
        s item.tags = []
        s item.value = (LicenseUsed/(LicenseAvailable+LicenseUsed))
        d json.%Push(item)
    }

    s maxDuration=0
    IF (##class(%Dictionary.CompiledClass).%ExistsId("%SYS.Journal.Transaction")) {
        set rs=##class(%ResultSet).%New()
        set rs.ClassName="%SYS.Journal.Transaction"
        set rs.QueryName="List"
        set sc=rs.Execute(0)
        while (rs.%Next()) {
            s pid = rs.Data("Pid")
            s StartTime = rs.Data("StartTime")
            s now=$H

            s item={"name":"hxey_ics_transaction_duration","tags":"","desc":"事务持续时间","value":0}
            s item.tags = []
            s tag={}
            s tag.name="pid"
            s tag.value=pid
            d item.tags.%Push(tag)
            s tag={}
            s tag.name="ip"
            s tag.value=##class(%SYSTEM.Process).ClientIPAddress(pid)
            d item.tags.%Push(tag)
            s duration = (+now)*3600*24+$P(now,",",2)-((+StartTime)*3600*24+$P(StartTime,",",2))
            s:duration>maxDuration maxDuration=duration
            s item.value = duration
            d json.%Push(item)
        }
    }

    s item={"name":"hxey_ics_transaction_maxduration","tags":"","desc":"最长事务持续时间","value":0}
    s item.tags = []
    s item.value = maxDuration
    d json.%Push(item)

    IF (##class(%Dictionary.CompiledClass).%ExistsId("%SYS.DatabaseQuery")) {
        Set statement=##class(%SQL.Statement).%New(1)
        Set sc=statement.%PrepareClassQuery("%SYS.DatabaseQuery","FreeSpace")
        Set rset=statement.%Execute()
        while (rset.%Next()) {
            s dbName = rset.%Get("DatabaseName")
            s freeRate = rset.%GetData(7)
            s dbAvailMB = rset.%Get("AvailableNum")
            s diskAvailMB = rset.%Get("DiskFreeSpaceNum")

            s item={"name":"hxey_ics_db_load","tags":"","desc":"数据库可用空间占用率","value":0}
            s item.tags = []
            s tag={}
            s tag.name="name"
            s tag.value=dbName
            d item.tags.%Push(tag)
            s item.value = (100-freeRate) / 100
            d json.%Push(item)
        }
    }

    IF (##class(%Dictionary.CompiledClass).%ExistsId("Ens.Queue")) {
        Set statement=##class(%SQL.Statement).%New(1)
        Set sc=statement.%PrepareClassQuery("Ens.Queue","Enumerate")
        Set rset=statement.%Execute()
        while (rset.%Next()) {
            s name = rset.%Get("Name")
            s count = rset.%Get("Count")

            s item={"name":"hxey_ics_queue_load","tags":"","desc":"队列等待数量","value":0}
            s item.tags = []
            s tag={}
            s tag.name="name"
            s tag.value=name
            d item.tags.%Push(tag)
            s item.value = count
            d json.%Push(item)
        }
    }
    return json
}

}
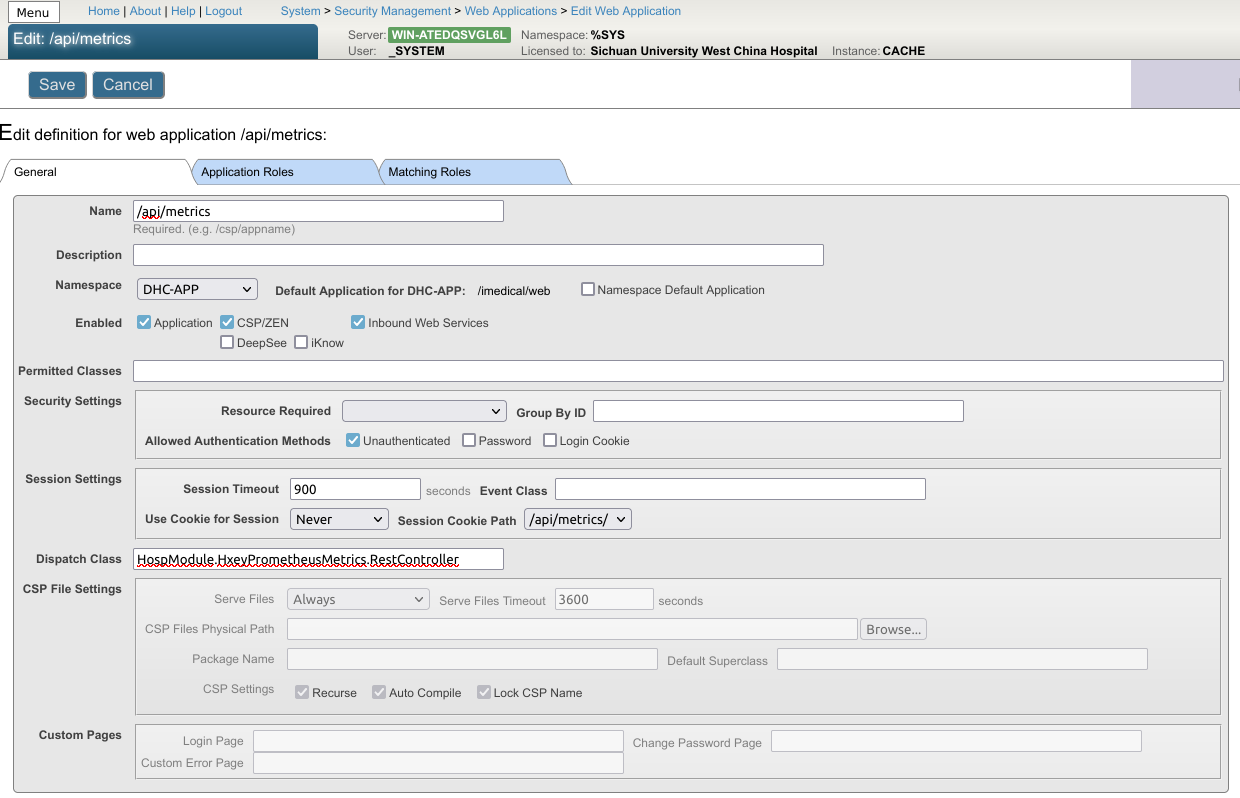
接口服务配置如下,
安装并运行Prometheus
Prometheus下载地址为https://prometheus.io/download/。
安装过程如下,
-
解压缩到安装目录。本文使用
/opt/prometheus作为安装目录。下述子目录及文件均相对于该安装目录。 -
修改配置文件
prometheus.yml-
主要配置内容为采集间隔和采集接口列表,如下,
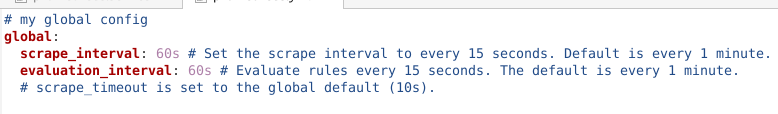
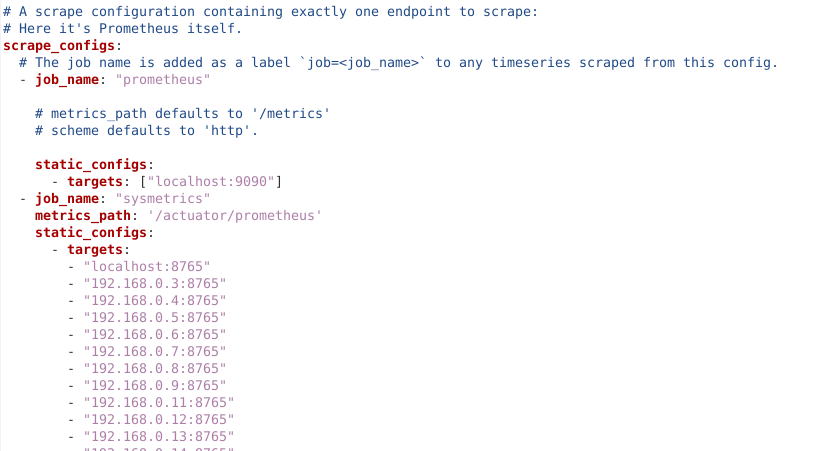
-
其他配置,如告警管理服务器和告警规则,可以按需配置。本文使用Grafana配置告警,不在这里配置。
-
Prometheus启动后,会定时、或者在收到
SIGHUP时重新加载该配置。
-
-
启动后
- 访问Web端口,默认
ip:9090,可查看配置、服务运行情况。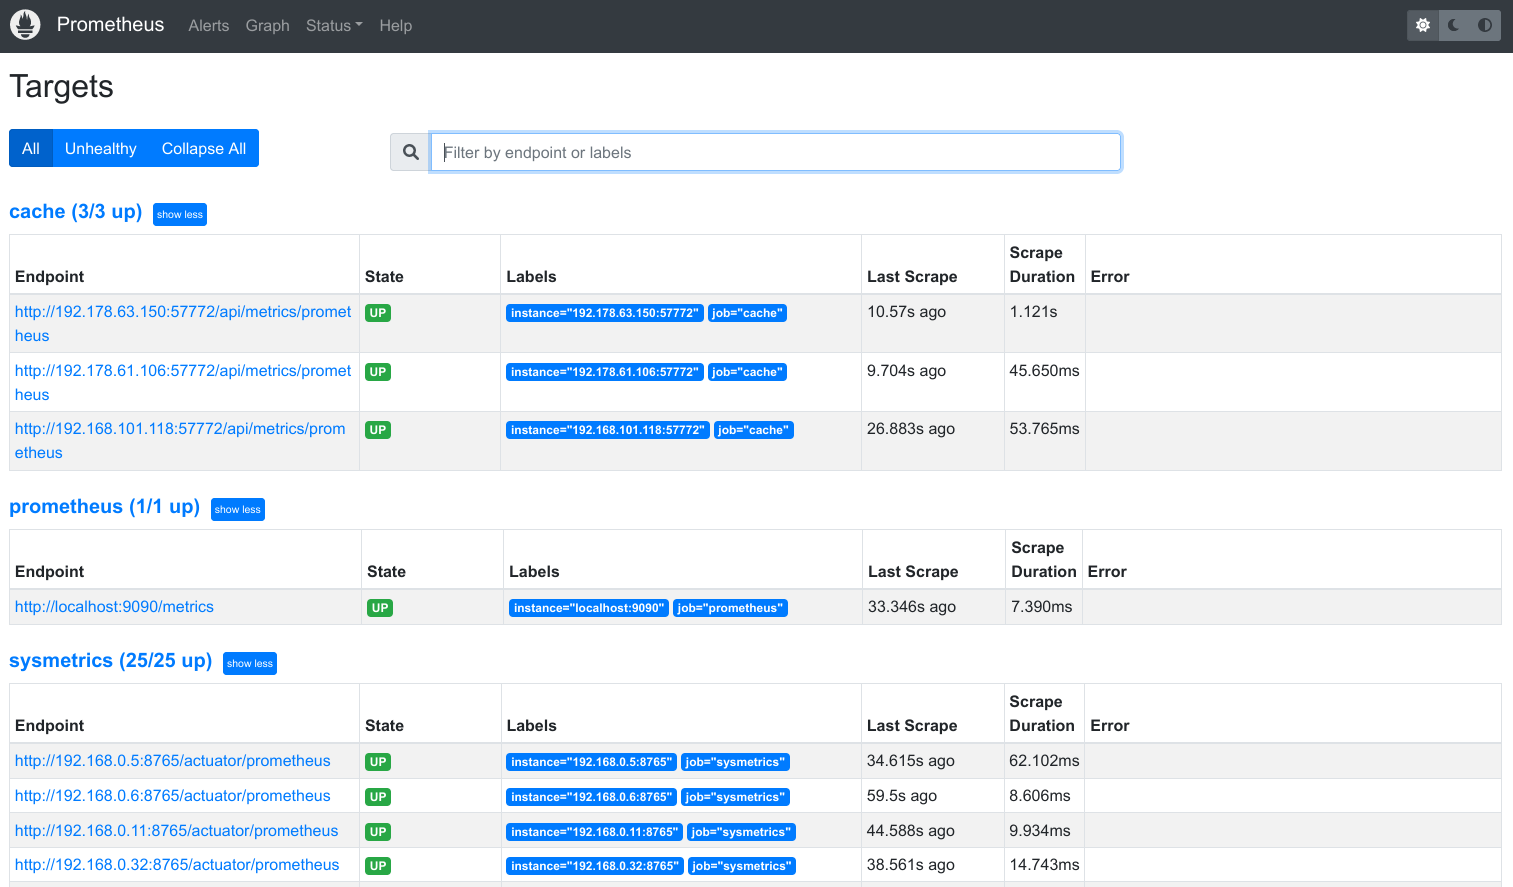
- 访问Web端口,默认
-
使用Systemd托管服务
-
新增文件
/usr/lig/systemd/system/prometheus.service,并写入如下内容,[Unit] Description=Prometheus Service After=network.target [Service] Type=simple User=app Restart=on-failure RestartSec=40s ExecStart=/opt/prometheus/prometheus \ --config.file=/opt/prometheus/prometheus.yml \ --storage.tsdb.path=/opt/prometheus/data \ --storage.tsdb.retention=90d ExecReload=/bin/kill -HUP $MAINPID KillMode=process [Install] WantedBy=multi-user.target -
添加为开机自动启动服务,在命令行执行
systemctl enable prometheus -
立刻启动服务,在命令行执行
systemctl start prometheus -
需要查看服务状态时,在命令行执行
systemctl status prometheus -
需要服务动态更新配置时,在命令行执行
systemctl reload prometheus -
需要关闭服务时,在命令行执行
systemctl stop prometheus
-
安装并运行Grafana
Grafana下载地址为https://grafana.com/grafana/download?pg=oss-graf&plcmt=resources。
安装过程如下,
-
解压缩到安装目录。本文使用
/opt/grafana作为安装目录。下述子目录及文件均相对于该安装目录。 -
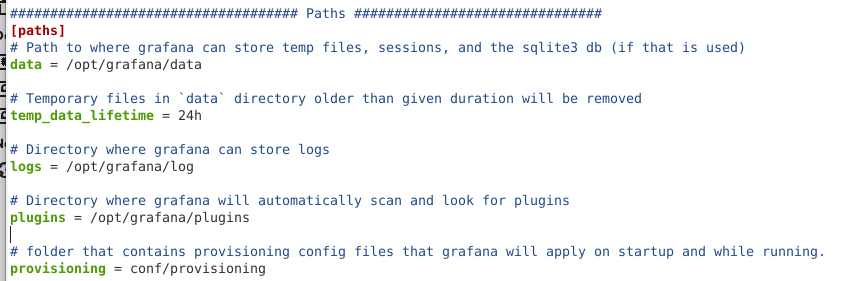
修改配置文件
conf/defaults.ini- 按需要修改文件存储地址,例如数据地址、日志地址。
- 其他配置例如监听端口(
http_port)、监听地址(http_addr)、数据库([database]章节)、接口安全配置([security]章节)都可以按需修改。 - 默认情况,Grafana Web服务在
ip:3000,使用内置SQLite数据库保存配置,接口无鉴权,默认管理员为admin。
- 按需要修改文件存储地址,例如数据地址、日志地址。
-
启动后
- 访问Web端口,默认
ip:3000,可配置数据源、用户、报表,如下图。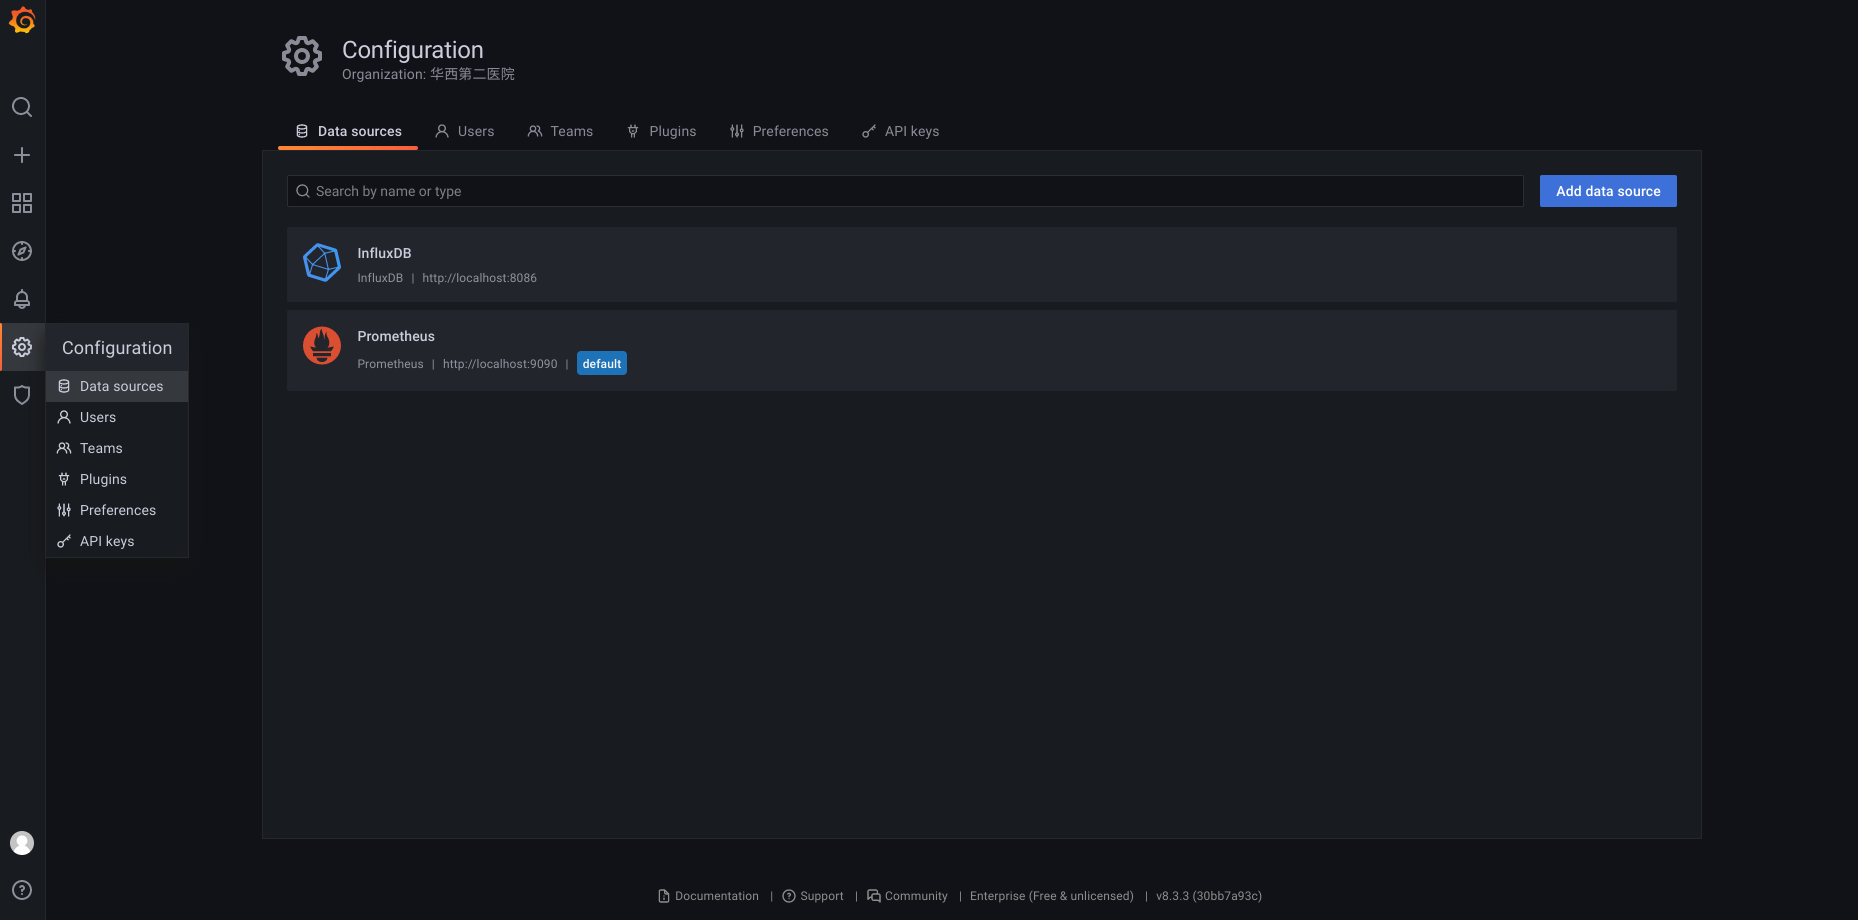
- 访问Web端口,默认
-
使用Systemd托管服务
-
新增文件
/usr/lig/systemd/system/grafana.service,并写入如下内容,[Unit] Description=Grafana Service After=network.target [Service] Type=simple User=app Restart=on-failure RestartSec=5s ExecStart=/opt/grafana/bin/grafana-server \ -homepath=/opt/grafana \ -config=/opt/grafana/conf/defaults.ini KillMode=process [Install] WantedBy=multi-user.target -
添加为开机自动启动服务,在命令行执行
systemctl enable grafana -
立刻启动服务,在命令行执行
systemctl start grafana -
需要查看服务状态时,在命令行执行
systemctl status grafana -
需要关闭服务时,在命令行执行
systemctl stop grafana
-
安装并运行Node Exporter
Prometheus生态中有一个Node Exporter,用于收集各操作系统的常用监控数据并暴露PULL接口。其下载地址和安装指南请参考https://grafana.com/oss/prometheus/exporters/node-exporter/
在实际应用时,Node Exporter提供的数据对不同操作系统略有差异,并且缺少必要的数据,例如与NTP时间服务器的时间偏置量。因此本文用Java实现了适合本机构的Node Exporter。为了实现稳定的跨操作系统的性能指标收集,使用 com.github.oshi:oshi-core:5.8.4库,示例代码如下,
    public double getLoad() {
        SystemInfo systemInfo = new SystemInfo();
        double load1 = systemInfo.getHardware().getProcessor().getSystemCpuLoadBetweenTicks(ticks);
        double load2 = systemInfo.getHardware().getProcessor().getSystemCpuLoadBetweenTicks(ticksLast);
        return Math.max(load1, load2);
    }
为了实现计算与NTP时间服务器的时间偏置量,使用commons-net:commons-net:3.8.0库,示例代码如下,
    public long getOffset() {
        NTPUDPClient ntpudpClient = new NTPUDPClient();
        ntpudpClient.setDefaultTimeout(5000);
        ntpudpClient.open();
        System.out.println(System.currentTimeMillis());
        InetAddress hostAddr = InetAddress.getByName(HOSTNAME);
        final TimeInfo info = ntpudpClient.getTime(hostAddr);
        ntpudpClient.close();
        info.computeDetails();
        return info.getOffset()
    }
接口实现效果如下,
# HELP hxey_memory_load 内存负载率
# TYPE hxey_memory_load gauge
hxey_memory_load{application="sysmetrics",hxey="hxey",} 0.42
# HELP disk_total_bytes Total space for path
# TYPE disk_total_bytes gauge
disk_total_bytes{application="sysmetrics",hxey="hxey",path="C:\\Users\\Administrator\\Desktop\\servermetrics\\.",} 2.78802722816E11
# HELP hxey_memory_total 内存总大小
# TYPE hxey_memory_total gauge
hxey_memory_total{application="sysmetrics",hxey="hxey",} 4.0
# HELP system_cpu_count The number of processors available to the Java virtual machine
# TYPE system_cpu_count gauge
system_cpu_count{application="sysmetrics",hxey="hxey",} 2.0
# HELP hxey_timestamp 服务器时间戳
# TYPE hxey_timestamp gauge
hxey_timestamp{application="sysmetrics",hxey="hxey",} 1.664506300883E12
# HELP hxey_disk_used 硬盘使用大小
# TYPE hxey_disk_used gauge
hxey_disk_used{application="sysmetrics",disk_label="C:\\[]",hxey="hxey",} 27.38
hxey_disk_used{application="sysmetrics",disk_label="D:\\[]",hxey="hxey",} NaN
hxey_disk_used{application="sysmetrics",disk_label="A:\\[]",hxey="hxey",} NaN
# HELP hxey_disk_total 硬盘总大小
# TYPE hxey_disk_total gauge
hxey_disk_total{application="sysmetrics",disk_label="C:\\[]",hxey="hxey",} 259.66
hxey_disk_total{application="sysmetrics",disk_label="D:\\[]",hxey="hxey",} NaN
hxey_disk_total{application="sysmetrics",disk_label="A:\\[]",hxey="hxey",} NaN
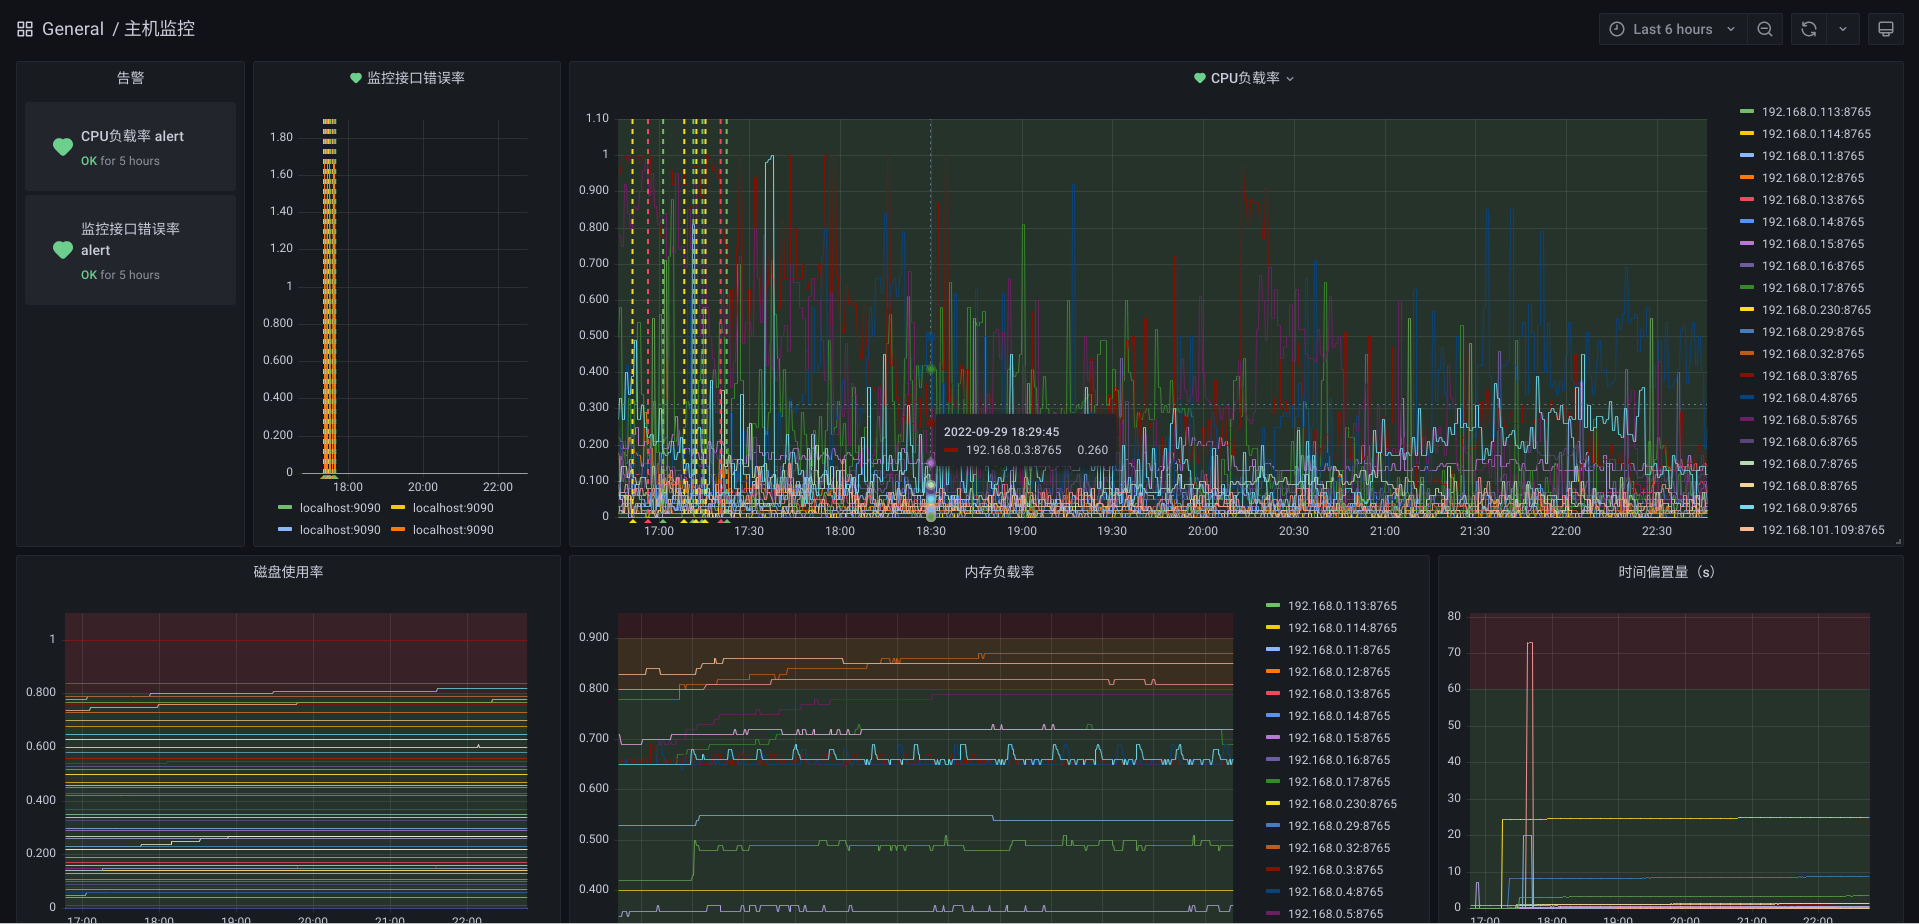
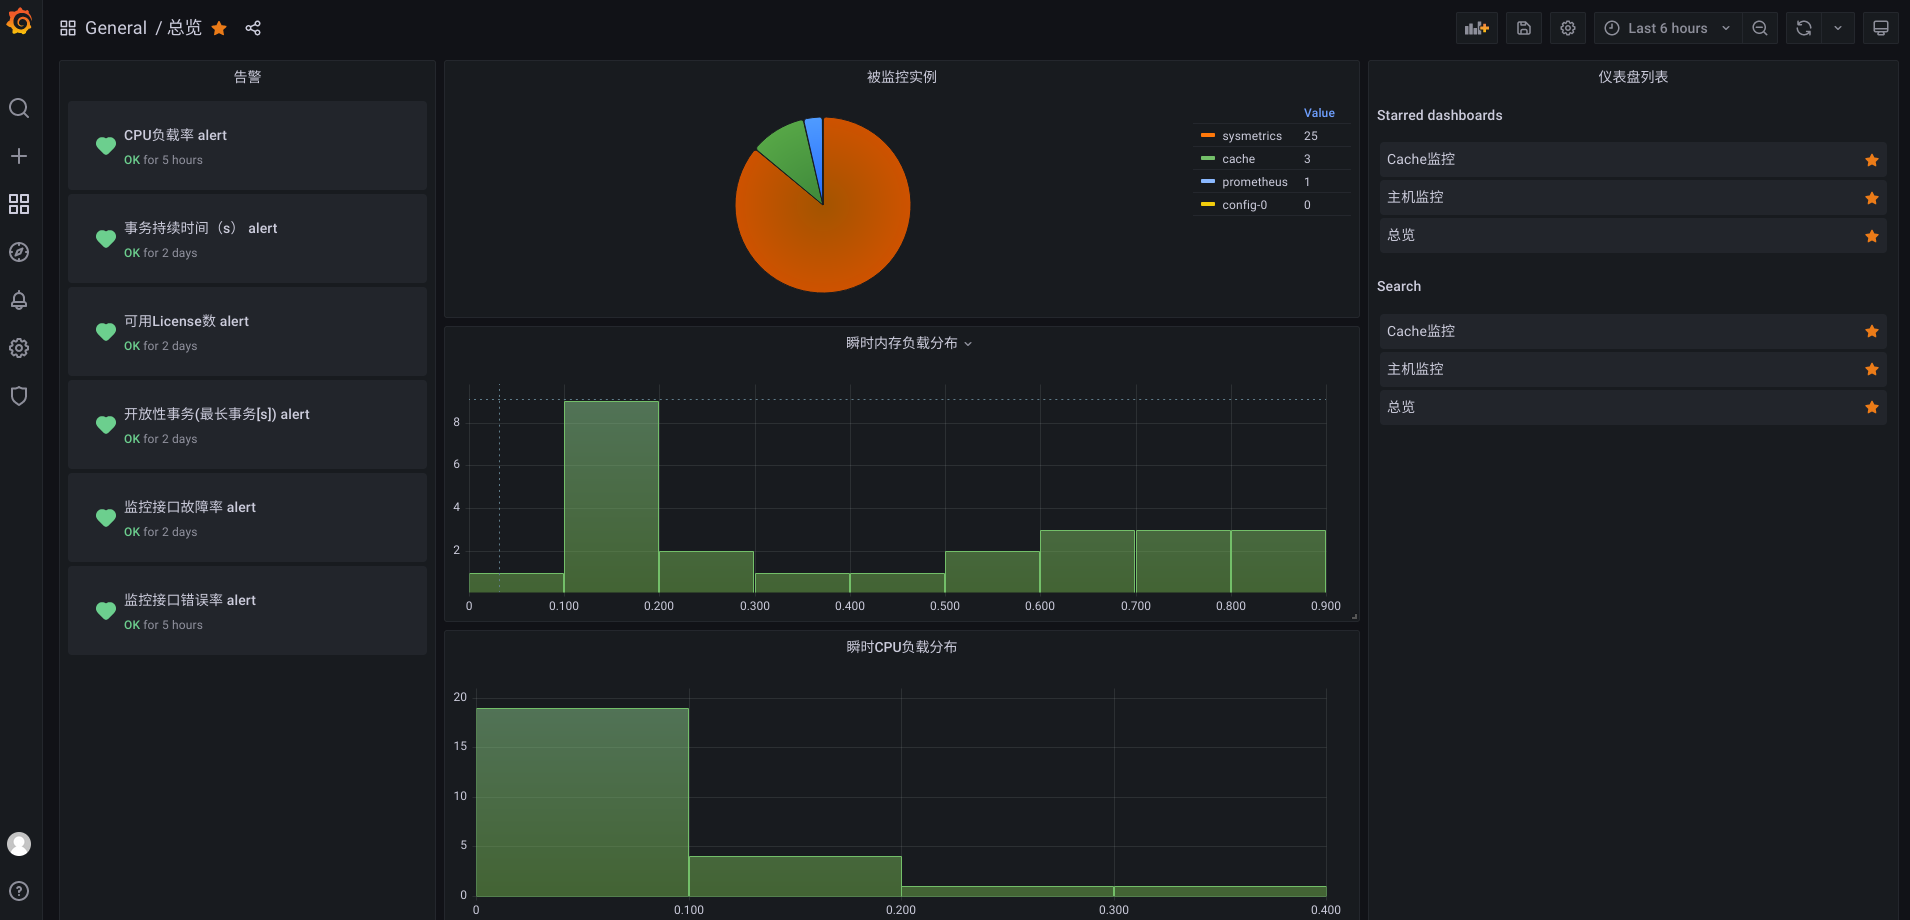
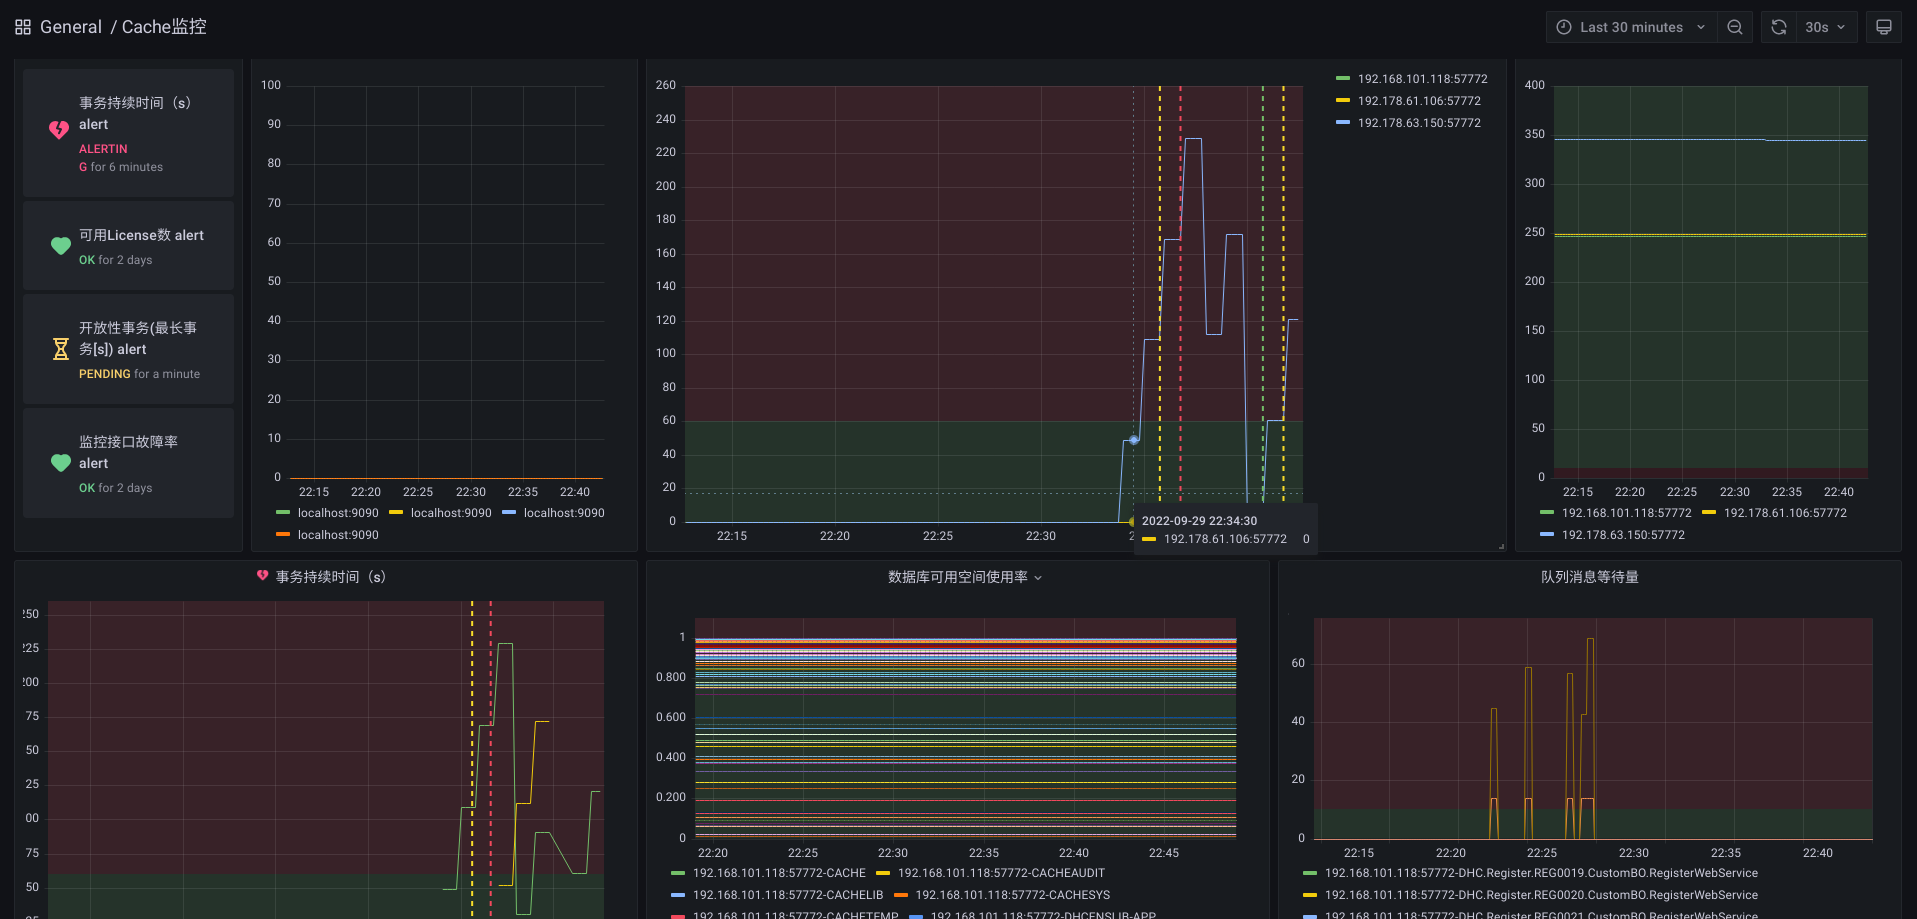
结果
搭建完成的Prometheus监控框架,能够准实时的收集和展示Cache中事务、Lisence使用率、消息队列等待长度、数据库使用率,以及操作系统时间偏置量、磁盘使用率、CPU使用率、内存使用率等指标。

讨论
任何监控系统,都是定时采集的,采集得到的指标是对现实中的连续指标的一个抽样。管理人员不能通过监控指标定位到故障原因,甚至不能精确定位到故障的实际发生时间。 为了弥补监控指标的缺憾,后期应为Cache集群添加日志采集系统,如Loki日志采集工具,建立起监控指标的异常和日志输出的对应关系,让异常定位更准确。
