Hello 社区成员们,
这篇文章是对Muhammad Waseem的 OpenExchange IRIS-Python-Apps 应用程序的介绍。 使用嵌入式 Python 和 Python Flask Web 框架构建。
应用程序还演示了一些 Python 功能,如数据科学、数据绘图、数据可视化和 QR 码生成。来看看最终效果:

特征:
- 响应式引导 IRIS 仪表板;
- 查看仪表板详细信息以及互操作性事件日志和消息;
- 使用 IRIS 中的 Python 绘图;
- 使用Jupyter Notebook;
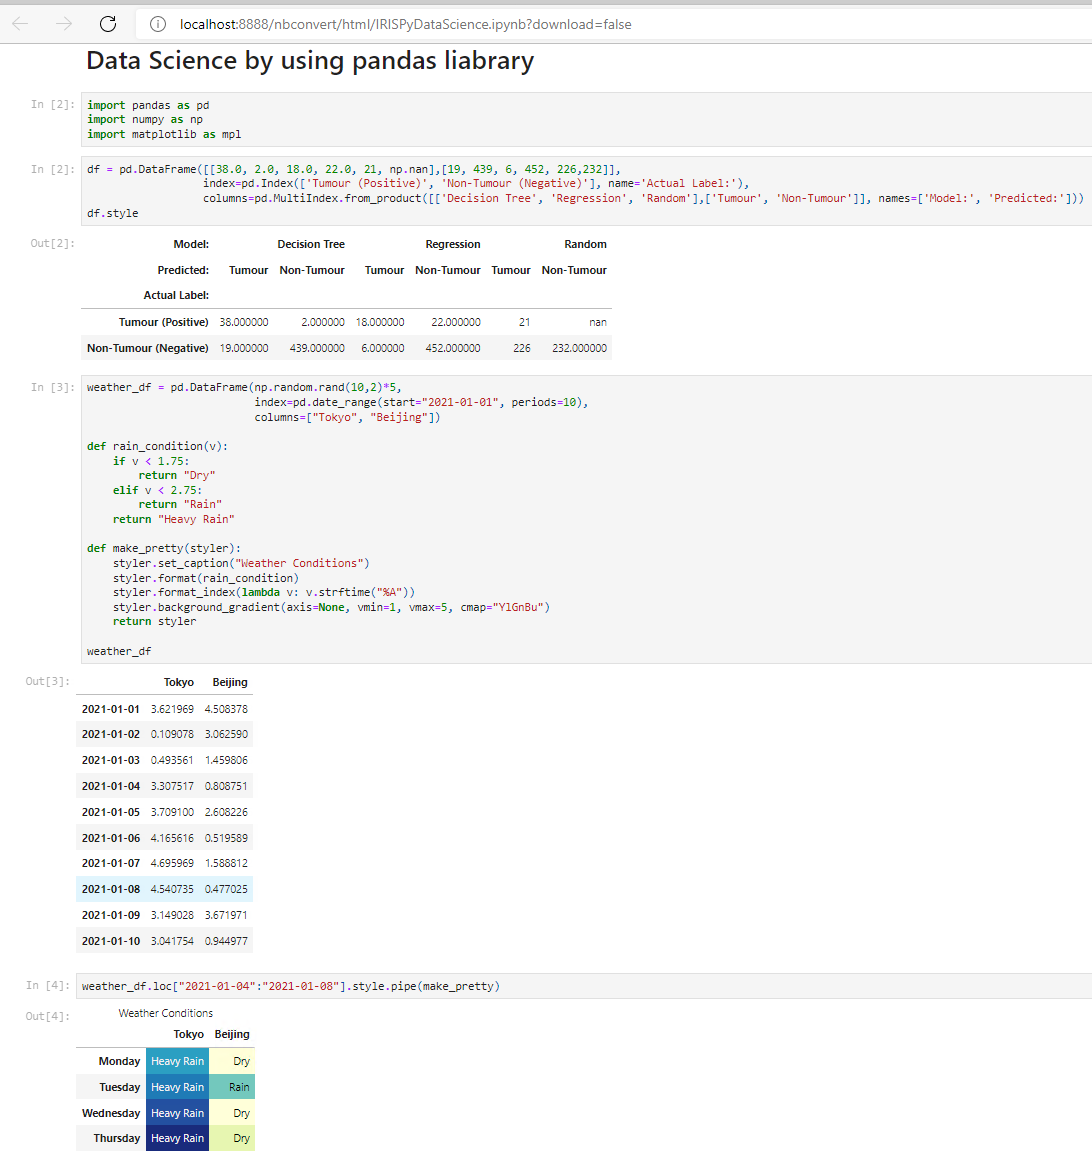
- 数据科学、数据绘图和数据可视化简介;
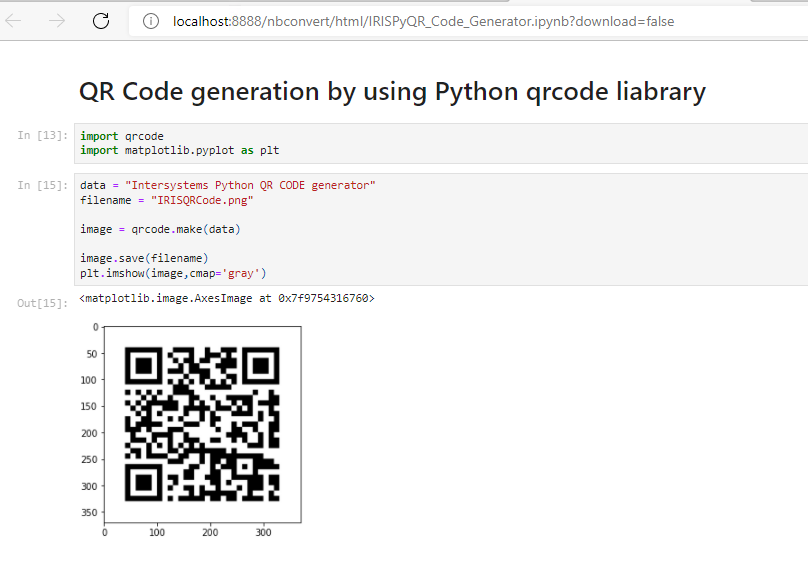
- 来自python的二维码生成器。
使用嵌入式 python 的响应式引导 IRIS 仪表板
下面是用户定义函数 get_dashboard_stats( ) 的代码,用于使用嵌入式 python 从 SYS.Stats.Dashboard IRIS 类中获取数据:
代码:get_dashboard_stats( )
import iris
// make sure to connect with %SYS namespace by using custom object script function
iris.cls("Embedded.Utils").SetNameSpace("%SYS")
ref = iris.cls("SYS.Stats.Dashboard").Sample()
last_backup = ref.LastBackup
#check if variable is empty
if not last_backup:
last_backup = "Never"
#content data dictionary to store data to be used in HTML page
content = {
'ApplicationErrors':ref.ApplicationErrors,
'CSPSessions':ref.CSPSessions,
'CacheEfficiency':ref.CacheEfficiency,
'DatabaseSpace' : ref.DatabaseSpace,
'DiskReads' : ref.DiskReads,
'DiskWrites' : ref.DiskWrites,
'ECPAppServer' : ref.ECPAppServer,
'ECPAppSrvRate' : ref.ECPAppSrvRate,
'ECPDataServer' : ref.ECPDataServer,
'ECPDataSrvRate' : ref.ECPDataSrvRate,
'GloRefs' : ref.GloRefs,
'GloRefsPerSec' : ref.GloRefsPerSec,
'GloSets' : ref.GloSets,
'JournalEntries' : ref.JournalEntries,
'JournalSpace' : ref.JournalSpace,
'JournalStatus' : ref.JournalStatus,
'LastBackup' : last_backup,
'LicenseCurrent' : ref.LicenseCurrent,
'LicenseCurrentPct' : ref.LicenseCurrentPct,
'LicenseHigh' : ref.LicenseHigh,
'LicenseHighPct' : ref.LicenseHighPct,
'LicenseLimit' : ref.LicenseLimit,
'LicenseType' : ref.LicenseType,
'LockTable' : ref.LockTable,
'LogicalReads' : ref.LogicalReads,
'Processes' : ref.Processes,
'RouRefs' : ref.RouRefs,
'SeriousAlerts' : ref.SeriousAlerts,
'ShadowServer' : ref.ShadowServer,
'ShadowSource' : ref.ShadowSource,
'SystemUpTime' : ref.SystemUpTime,
'WriteDaemon' : ref.WriteDaemon,
'tot_pro' : tot_pro,
'tot_msg' : tot_msg,
'tot_usr' : tot_usr,
'tot_apps' : tot_apps,
'tot_ev' : tot_ev,
'tot_ev_assert' : tot_ev_assert,
'tot_ev_error' : tot_ev_error,
'tot_ev_warning' : tot_ev_warning,
'tot_ev_info' : tot_ev_info,
'tot_ev_trace' : tot_ev_trace,
'tot_ev_alert' : tot_ev_alert
}
return content
以下是调用 get_dashboard_stats( ) 用户定义函数以获取 deta、渲染 index.html 页面并将内容数据传递给它的主要 python 代码 (app.py):
@app.route("/")
def index():
#get dashboard data in dictionary variable
content = util.get_dashboard_stats()
return render_template('index.html', content = content)
index.html 使用内容字典变量来显示相关数据。 例如 {{ content.CSPSessions }} 用于显示 CSP 会话:
{{ content.CSPSessions }}
<div class="row">
<div class="col-lg-2 col-6">
<!-- small box -->
<div class="small-box bg-info">
<div class="inner">
<h3>{{ content.CSPSessions }}</h3>
<p>CSP Sessions</p>
</div>
<div class="icon">
<i class="ion ion-ios-photos"></i>
</div>
<a href="/processes" class="small-box-footer">View Details <i class="fas fa-arrow-circle-right"></i></a>
</div>
</div>
在仪表板中,我们还可以使用 iris.sql.exec() 功能查看正在运行的进程、消息、安全用户、应用程序和事件日志的详细信息。 
应用程序还使用 python matplotlib 库以 HTML 格式显示绘图:
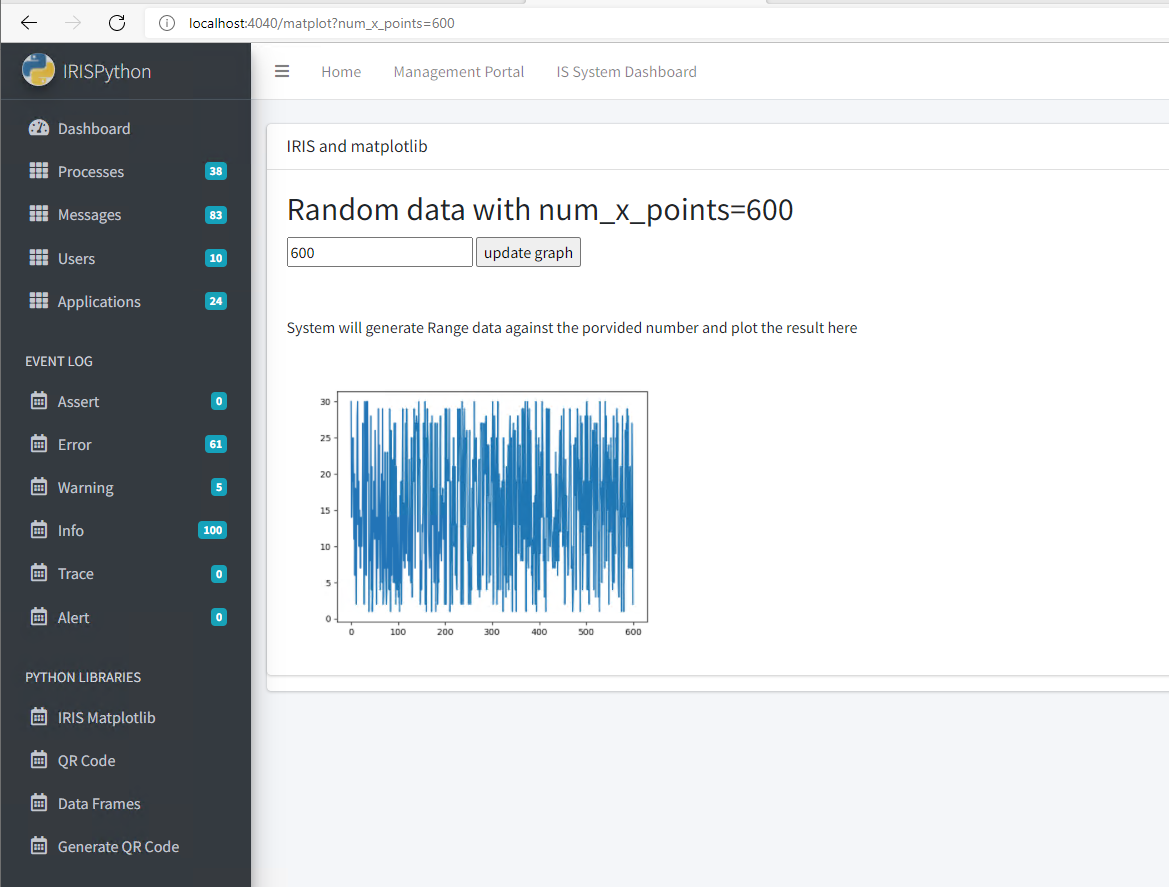
下面是在 html 中显示绘图的 python 代码:
app.route("/matplot")
def matplot():
#Returns html with the img tag for your plot.
content = util.get_sidebar_stats()
num_x_points = int(request.args.get("num_x_points", 50))
return render_template('matplot.html', content = content, num_x_points = num_x_points)
@app.route("/matplot-as-image-<int:num_x_points>.png")
def plot_png(num_x_points=50):
# renders the plot on the fly.
fig = Figure()
axis = fig.add_subplot(1, 1, 1)
x_points = range(num_x_points)
axis.plot(x_points, [random.randint(1, 30) for x in x_points])
output = io.BytesIO()
FigureCanvasAgg(fig).print_png(output)
return Response(output.getvalue(), mimetype="image/png")
数据科学简介、数据绘图、数据可视化和使用 Jupyter Notebook 生成二维码: